 Vegetation Indices has proved to have an extremely wide (and growing) range of applications. It is used to monitor vegetation conditions and therefore provide early warning on droughts and famines.
Most commonly used vegetation index is Normalized Vegetation Difference Index (NDVI). Other indices are used, with a range of complexities. Indices are chosen depending on their application. The simplest vegetation index is the Ratio Vegetation Index (RVI).
A more complex index is the Perpendicular Vegetation Index (PVI) that takes into account the soil emissivity (one of the major limitations of NDVI).
Normalized Vegetation Difference Index (NDVI)
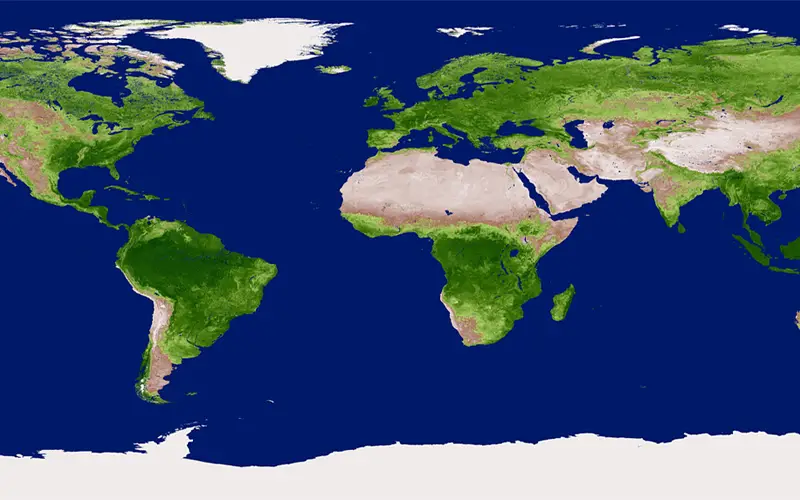
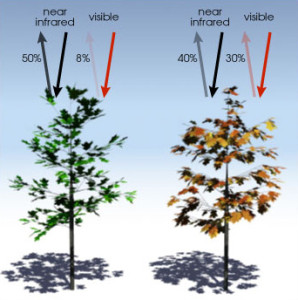
The Normalised Difference Vegetation Index (NDVI) is a measure of the vegetative cover on the land surface. NDVI also identifies water and ice. Vegetation differs from other land surfaces because it tends to absorb strongly the red wavelengths of sunlight and reflect in the near-infrared wavelengths. The Normalised Difference Vegetation Index (NDVI) is a measure of the difference in reflectance between these wavelength ranges. NDVI takes values between -1 and 1, with values 0.5 indicating dense vegetation and values <0 indicating no vegetation.
NDVI = (NIR – Red) / (NIR + Red)
The Ratio Vegetation Index (RVI)
The simplest vegetation index is the RVI, which takes the ratio of the near infrared (NIR) and red (R) radiances.
RVI=NIR/R
The Perpendicular Vegetation Index (PVI)
It has been found that there is a more or less linear relationship between Red and NIR reflectances from bare soils. This was tested for several different soil types, including sand, pebbles and clay. It was even true when the roughness and moisture of the soil varied. This relationship is called the soil line (shown in Figure 2) and is given by
NIRsoil=a Rsoil + b
In calculating the PVI of a surface with vegetation, the reflectance in the red and NIR ranges are measured and plotted on a graph. The PVI is the perpendicular distance of the measured point from the soil line, defined as follows:
PVI=1/sqrt(a2+1) x (NIR – aR + b)
where a and b are the slope and gradient of the soil line respectively. This is shown in Figure 2. In this way, the PVI measures the changes from the bare soil reflectances caused by the vegetation. In this way it gives an indication of vegetative cover independent of the effects of the soil.
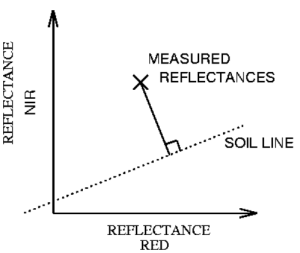
Figure 2: The cross represents the measured red and infrared reflectances. The dashed line is the soil line.
Related Article:


please help me what is the minimum and maximum value of advance vegetation index