
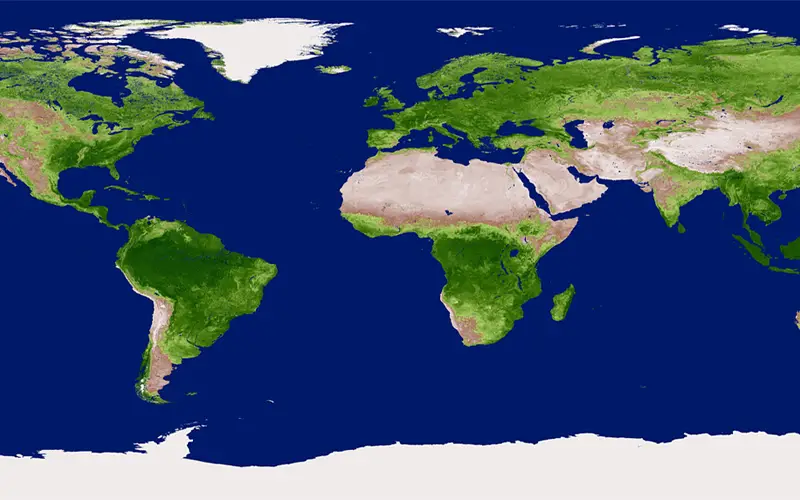
The Normalised Difference Vegetation Index (NDVI) is a measure of the vegetative cover on the land surface. Dense vegetation shows up very strongly in the imagery, and areas with little or no vegetation are also clearly identified. NDVI also identifies water and ice. Vegetation differs from other land surfaces because it tends to absorb strongly the red wavelengths of sunlight and reflect in the near-infrared wavelengths. The Normalised Difference Vegetation Index (NDVI) is a measure of the difference in reflectance between these wavelength ranges. NDVI takes values between -1 and 1, with values 0.5 indicating dense vegetation and values <0 indicating no vegetation. NDVI has proved to have an extremely wide (and growing) range of applications. It is used to monitor vegetation conditions and therefore provide early warning on droughts and famines.
Although NDVI data has proved to be extremely useful it can only be used properly when the user is aware of the many limitations of the data.
NDVI: How it is calculated.
Since 1982, NASA has produced NDVI images of Africa three times a month, building up a valuable archive of the conditions in Africa over the period. This allows present conditions to be compared with those in previous years.
When the first NOAA satellites were launched, channels 1 and 2 on the AVHRR were designed to monitor clouds, ice and land/water boundaries. However, researchers quickly realised the two channels could be combined to detect vegetation using the different reflectance of vegetation in the two channels. Chlorophyll absorbs light in the red channel 1 (0.58-0.68 microns) and foliage reflects light in the near infrared channel 2 (0.72-1.10 microns). This is shown in Figure 1 and Figure 2. Therefore, higher photosynthetic activity will result in lower reflectance in the red channel and higher reflectance in the near infrared channel. This signature is unique to green plants.
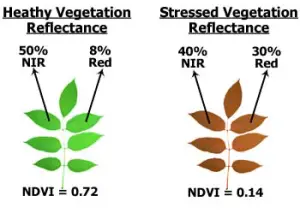
Figure 1: Vegetation spectral reflectance.
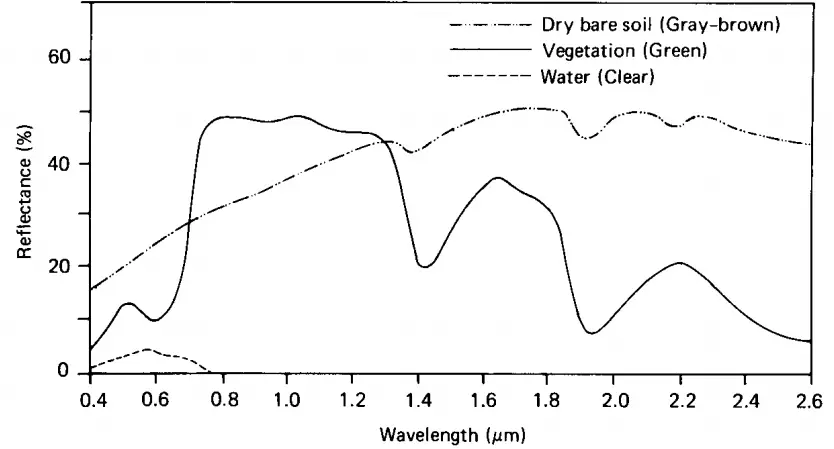
Figure 2: Typical reflectance curve for vegetation, soil and water [Lillesand and Kiefer, 1994].
By combining the two channels in a ratio or difference, allows the response to vegetation growth to be distinguished from the background signal. The method, developed by NASA is known as the Normalised Difference Vegetation Index (NDVI) and is given by the equation (NIR-RED/NIR+RED), where RED and NIR correspond to channels 1 and 2 respectively. By normalising the difference in this way, the values can be scaled between a value of -1 to +1. This also reduces the influence of atmospheric absorption. Tabel 1 shows typical reflectance values in the red and infrared channels, and the NDVI for typical cover types. Water typically has an NDVI value less than 0, bare soils between 0 and 0.1 and vegetation over 0.1.
|
COVER TYPE |
RED |
NIR |
NDVI |
|
Dense vegetation |
0.1 |
0.5 |
0.7 |
|
Dry Bare soil |
0.269 |
0.283 |
0.025 |
|
Clouds |
0.227 |
0.228 |
0.002 |
|
Snow and ice |
0.375 |
0.342 |
-0.046 |
|
Water |
0.022 |
0.013 |
-0.257 |
Table 1: Typical NDVI values for various cover types [Holben, 1986].
NDVI: IRS 1C LISS-3 (Sensor) Product.
Figure 2 is showing the NDVI image of Mewat district of Haryana, India calculated for February 08 1998. The data used to calculate NDVI was of LISS-3 sensor of IRS 1C.
Following formula was used to obtain NDVI.
NDVI = (NIR – Red) / (NIR + Red) = (Band 3 – Band 2) / (Band 3 + Band 2)


Figure 3: NDVI image of Mewat district of Haryana, India February 08 1998
Different satellites have different bands for red and near infra red regions. Following are the formulas for calculating NDVI from most common satellites:
LANDSAT TM:
NDVI = (NIR – Red) / (NIR + Red) = (Band 4 – Band 3) / (Band 4 + Band 3)
LANDSAT MSS:
NDVI = (NIR – Red) / (NIR + Red) = (Band 4 – Band 2) / (Band 4 + Band 2)
AVHRR:
NDVI = (NIR – Red) / (NIR + Red) = (Band 2 – Band 1) / (Band 2 + Band 1)
SPOT:
NDVI = (NIR – Red) / (NIR + Red) = (Band 3 – Band 2) / (Band 3 + Band 2)
AVIRIS:
NDVI = (NIR – Red) / (NIR + Red) = (Band 4 – Band 4) / (Band 4 + Band 4)
IRS 1C (LISS – 3), IRS 1D (LISS – 3), IRS P6 (LISS – 3):
NDVI = (NIR – Red) / (NIR + Red) = (Band 3 – Band 2) / (Band 3 + Band 2)
NDVI: Limitations.
1. Temporal resolution
It is important to get the right balance between the temporal resolution of data and the timescale of variation in the quantity measured. For example, maximum value composites of NDVI data are rarely less than dekadal. Consequently, NDVI MVC’s should not be used to investigate short-term events like forest fires. It is more appropriate to use NDVI data to monitor longer-term events like the growth of vegetation through a season, or annual rates of deforestation.
2. Atmospheric Interference
Light is scattered in all directions by particles in the atmosphere. Scattering tends to increase the amount of red radiation received by the satellite as red is more readily scattered in the atmosphere than near infrared. This has the effect of reducing NDVI values. For short periods, this problem is minimized by taking the maximum value composite because each pixel’s maximum value is likely to have occurred when scattering was at a minimum.
However, in extreme cases of long-term, large-scale aerosol events, such as ash clouds from the Mt. Pinatubo eruption in June 1991, maximum value compositing will not work. Mt. Pinatubo erupted in the Philippines explosively in June 1991. The vertical force of the eruption pushed massive amounts of material into the stratosphere, the upper levels of the atmosphere. These stratospheric aerosols had a great effect on the clarity of the atmosphere and artificially reduced NDVI values. A correction procedure was developed by NASA, but not all the corrected images were of high quality.
3. Land cover types
With the exception of very large irrigation schemes and commercial agriculture, an NDVI pixel very rarely covers a single homogeneous agricultural region. Instead it may cover roads, buildings, bare soil, small water bodies, natural vegetation and agriculture, all within one pixel. An NDVI pixel is the sum of the radiation reflected from all the land cover types within the area covered by the pixel. NDVI is an indicator of the condition of the overall vegetation in an area, including natural vegetation and agriculture. In rain-fed agriculture, natural vegetation may follow similar patterns to the agriculture.
More often however, agriculture is more susceptible to adverse conditions and follows different growth cycles. When looking at NDVI, always remember that you are looking at general conditions and not necessarily the condition of a specific crop.
4. Sparse vegetation and soil-type
Light reflected from the soil can have a significant effect on NDVI values (changing the values by up to 20%). Generally, the greater the radiance reflected from the soil, the lower the NDVI values. The soil-type therefore is an important factor. Given two soil types, one with a greater reflectivity but with similar vegetative conditions, the soil with the greater reflectivity will on average produce lower NDVI values. Huete and Jackson found that the soil-type had the greatest effect on NDVI values between 40 and 75% vegetative cover.
5. Sensor degradation
The satellite radiometer degrades over time. Consequently, the calibration coefficients are not constant. The thermal channels of the AVHRR have internal systems of calibration, but the visible channel (1) does not. The simplest technique for calibration of channel 1 is to use stable targets on the Earth’s surface such as desert sands and oceans. Corrections are applied directly to the NDVI using the deviation from the expected values found in the Sahara desert. The use of an offset to the NDVI is simplistic because the correction factor may vary over the range of NDVI values, but it is better than no correction at all. When using NDVI imagery, care must be taken to ensure the data has been corrected, and if not, then to make the corrections yourself.
Related articles: