Monitoring and Modeling of Urban Growth Through Remote Sensing and GIS
Monitoring and Modeling of Urban Sprawl Through Remote Sensing and GIS in Kuala Lumpur, Malaysia
– Mukesh Singh Boori, Maik Netzband , Komal Choudhary and Vít Voženílek
Kuala Lumpur is one of the most important historical, cultural, industrial, and commercial cities in Malaysia as well as one of the most important cities in Asia. It has a booming economy with dynamic growth. During the last three decades, growth in population, industry, and economic activities has been strongly concentrated in the Kuala Lumpur metropolitan area.
The Kuala Lumpur Structure Plan 2020 indicates that the population base is set to increase from 1.4 million to 2.2 million over the next 20 years and that optimizing limited land resources will be a priority. The new Kuala Lumpur 2020 Strategy Plan was undertaken in the early 2000s to revise the 1984 Kuala Lumpur Structure Plan and to cope with the unprecedented growth and changes in the urban landscape. It is made compulsory to study Kuala Lumpur urban growth.
The objective of this study is to determine the spatial patterns of urban growth over time in Kuala Lumpur. Thus, the growth has been systematically mapped, monitored, and accurately assessed using satellite images in concert with conventional ground data. Mapping provides a “picture” of where growth is occurring, helps to identify the environmental and natural resources threatened by such development, and suggests the likely future directions and patterns of growth. The current study has three specific objectives:
- Investigate the growth of Kuala Lumpur City during 1989–2014 by using remote sensing and GIS;
- Analyze the existence of urban sprawl in Kuala Lumpur, and
- Evaluate current local environmental and natural resource protection and development policies.
A selection of multi-sensor and multi-temporal images was used for this study. The specific satellite images used were Landsat TM for 1989, Landsat ETM+ for 2001, and finally Landsat 8 for 2014, an image captured by different types of sensor. The spatial resolution is 30 m for band numbers 1 to 5 for all sensors, which is used in this research work. As all images have the same spatial resolution for specific bands, one simply goes through maximum likelihood classification. Here, at least 10 years’ time difference was used in two dates’ data so that sufficient land use/ cover change information can be investigated.
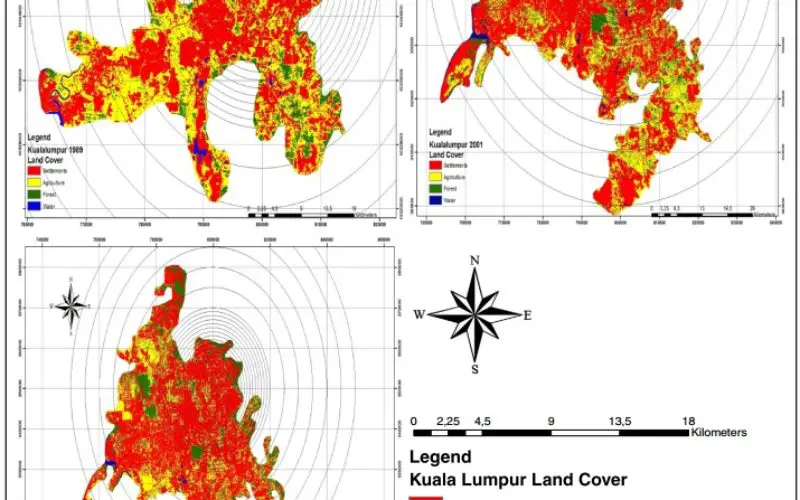
The images obtained as standard products were geometrically and radiometrically corrected by data providers, but, because of the different standards and references used by the various image-supplying agencies, all images were georeferenced again at the pre-processing stage. Then, all three images were geometrically corrected up to the orthorectified level. Images from different sensors have different spatial resolutions. In this study, we preferred to retain the spatial detail, original pixel size, and value of each image for specific bands. Therefore, the images were kept without changing their pixel sizes despite the possible varying accuracy level of classification with the different spatial, spectral, and radiometric resolutions. Next, at the classification stage, a uniform supervised classification was applied on the images. All of the images were classified by creating accurate polygons as training areas for introducing ideal classes for each image separately and by using the maximum likelihood classification method. To create a closer correspondence between the maps produced, the classification was done by only considering four main classes: urban built-up area, agriculture land, forest land (tree/park), and water.
Post-classification refinement was used to improve the accuracy of the classification. In addition, because the urban surface is heterogeneous with a complex combination of features (buildings, roads, grass, trees, soil, and water), mixed pixels and the salt-and-pepper effect are common problems when using medium spatial resolution data, such as Landsat. In this step, a 3 × 3 majority filter was applied to all the classified land covers.
This research is focused on urban built-up and urban vegetation coverage measurement and their interactions. Rangeland is considered to be both non-urban vegetation and forest area.
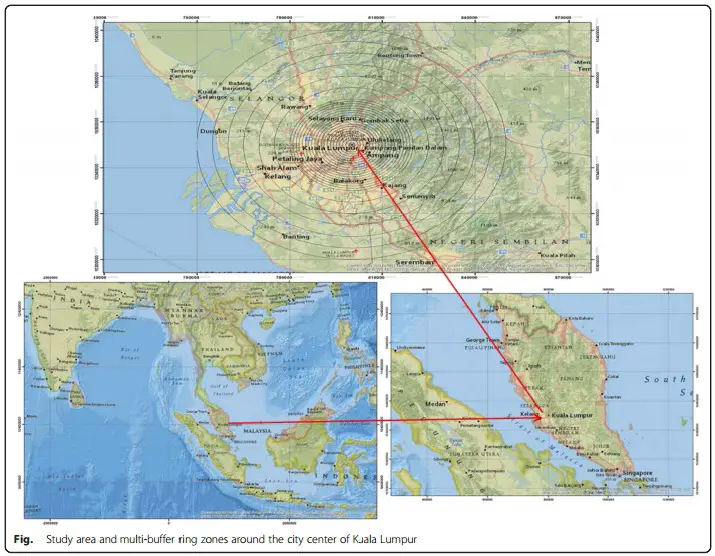
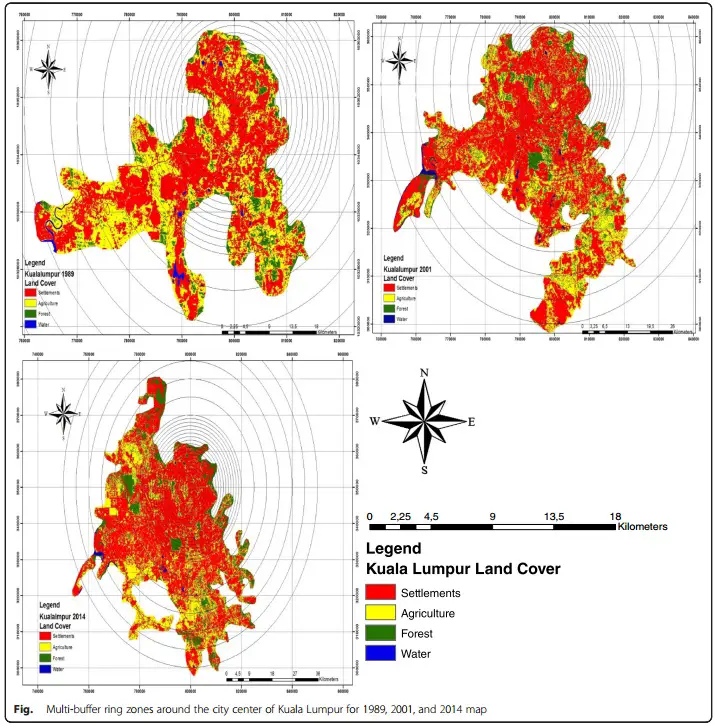
After classification, multi-buffer rings are created for every 1-km distance from 1 to 50 km from the city center to the outside. Then, the intersection with classified maps for all three dates is performed. Later on, all class areas were measured for 1- to 50-km distance and derive density according to:
Urban density = Settlement area ring / Total area
In this research work, more than 10 samples/training sites have been selected for each class so that classification accuracy is high. The high level of accuracy observed in this study could be the result of the coarse classification since only four classes were used. Furthermore, in all buffer rings, only the urban area was calculated in place of the whole ring. After producing complete land use maps, the total coverage of different classes was determined. Using this information, we calculated the water, forest, vegetation, and built-up area per capita for all the study years.
There are several major trends evident in the changes of land cover that are consistent over the period 1989 to 2014. The urban/built-up area increased rapidly, and there was a marked decrease in other classes.
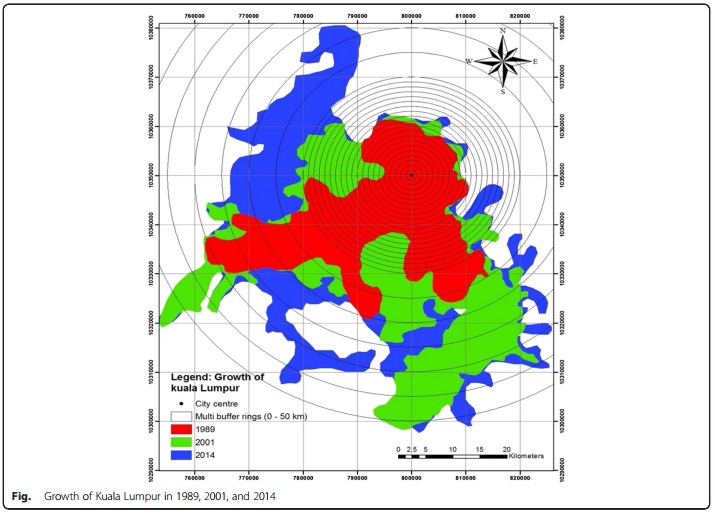
In comparing 1989 and 2014 on distances of 5, 8, 15, 20, and 30 km, the city density was increased very high. In 1989 to 2001, on the distances of 8, 15, and 19 km, the city density has been highly increased. From 2001 to 2014, on the distances of 4 and 30 km, density has increased and on 50-km distance, the city density was 0 % in the last three decades. In Kuala Lumpur, urban land expansion has largely been shaped by the terrain such as mountains and lakes and social factors such as population growth, migration, and economic development.
The empirical investigation of urban residential density patterns presented in this paper offers new insights into the spatial implications of policy changes. Analysis has the potential to aid urban planners and policy practitioners in evaluations of urban consolidation or compact city policies.
Source: Boori et al. Ecological Processes (2015) 4:15 DOI 10.1186/s13717-015-0040-2