Glaciers are always having an important impact on environment. Changing climate conditions have put a lot of pressure on our glaciers. Melting of glaciers could be very dangerous for life on this planet.
In a research study by Di Wang et al., titled “Modeling Glacier Elevation Change from DEM Time Series” an approach is made to study the elevation change in glacier using time series data of Digital Elevation Model (DEM).
The study describes modeling the evolution of glacier elevation and estimating related volume change, with focus on medium-resolution and noisy satellite DEMs. The method is robust with respect to outliers in individual DEM products. Quantifying detailed glacier volume evolution over large areas worldwide, which is only feasible using spaceborne methods, would help to better understand glacier response to weather and climate, and how glacier change affects for instance sea level and river runoff.
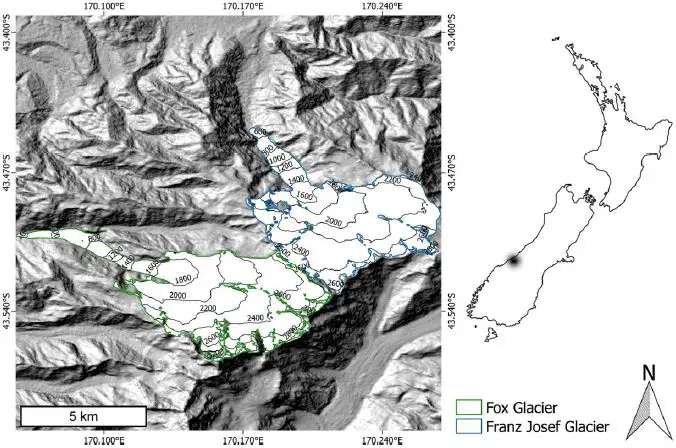
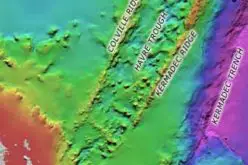
Study area. Shaded relief showing Fox Glacier and Franz Josef Glacier located in the Southern Alps, New Zealand. Glacier extents are from the Randolph Glacier Inventory
Satellite derived DEM time series have a high potential in assessing glacier elevation evolution, which is not yet fully exploited. In simple words, time series of a large number of DEMs could be used to overcome the deficiencies of individual DEMs by statistical means.
Glaciers have rapid change in elevation values. Glaciers behave not necessarily linearly in elevation. Especially glaciers that have short reaction times (typically maritime glaciers) fluctuate rapidly to adjust to variations in accumulation and ablation. To assess higher-order elevation variation are thus needed. A method is developed know as “Surface Elevation Reconstruction and Change Detection (SERAC)” to detect the surface elevation change of the Greenland Ice Sheet based on ICESat data. The method uses polynomial regressions instead of common linear regression, being able to reconstruct variations of elevation change.
In this study, a methodology is presented for glacier elevation reconstruction from DEM time series (tDEM), generating a 4-dimensional (4D) DEM which includes time as an additional dimension to the traditional 3-dimensional spatial coordinates.
Study Area and Data:
Fox Glacier and Franz Josef Glacier are located on the west side of Mt. Cook in the Southern Alps of New Zealand, with Franz Josef Glacier to the Northeast of Fox Glacier.
The data sources are:
- The Shuttle Radar Topography Mission (SRTM) DEM, the C-band SRTM DEM is available via the U.S. Geological Survey (USGS) at a resolution of 1 arc second (~30 m grid) globally.
- The Advanced Spaceborne Thermal Emission and Reflection Radiometer (ASTER) DEM is an imaging instrument onboard the Terra satellite.
- Topographic DEM and Glacier Outlines: A New Zealand national DEM generated based on topographic contours from 1986 aerial photos is in parts incorporated into this study to extent the study time period. The topographic DEM has a ground resolution of 15 m. Glacier outlines used are provided by the Randolph Glacier Inventory.
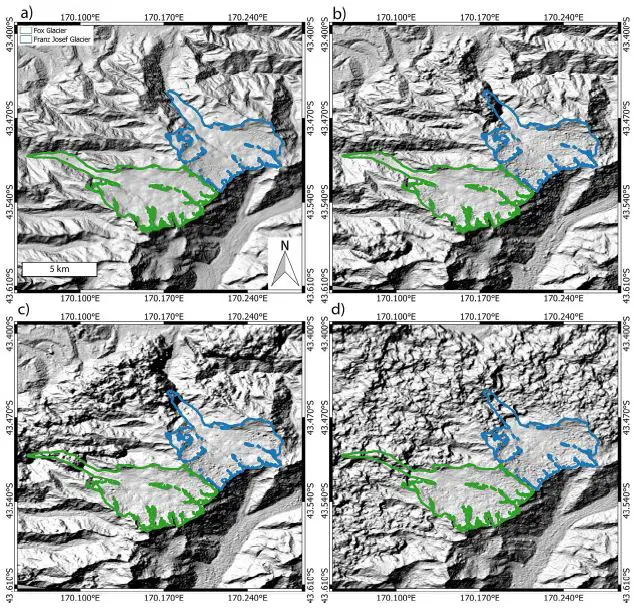
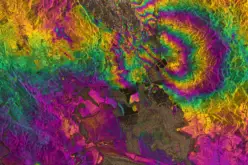
Different typical example ASTER DEMs over the study area. (a) ASTER GDEM2 features smooth terrain without outliers (b) ASTER DEM 2001/04/07 contains noticeable outliers over the glacier tongues, as do (c) ASTER DEM 2001/08/09 and (d) ASTER DEM 2014/02/24. The examples illustrate that any time series analysis has to be particularly robust against elevation outliers.
Methods:
DEM Co-Registration: Co-register of all ASTER DEMs and the topographic DEM to the SRTM DEM, leaving all the DEMs horizontally and vertically aligned properly in order to calculate glacier elevation without major first-order biases.
DEM Time Series (tDEM): tDEM method filters out outliers (caused by clouds and low visual contrast in images, or by image distortions over steep terrain) by dividing DEM pixels into two categories; one where reference data are available, and the other where there are no or insufficient reference data such as pixels in the voids of the SRTM DEM. As the SRTM DEM is regarded as the reference DEM in the study, only pixels that fall over SRTM voids will have no reference data.
For pixels that have no reference data, the RANSAC (RANdom SAmple Consensus) algorithm is employed. RANSAC is an algorithm for smoothing data that contain a certain percentage of outliers.
Modeling Scheme:
A “polynomial – spline” modeling scheme within our tDEM method for the elevation variation at each individual pixel. First, a simple weighted linear regression is performed pixel-wise to the filtered data to fit the trend of elevation change. Each elevation is weighted inversely by its accuracy.
The process is done pixel-wise so that a 4-dimensional (4D) model can be finalized by integrating pixels over the whole glacier. The 4D model contains the 3D coordinates of the glacier and adds time as an additional dimension in the form of linear, quadratic, cubic or spline model parameters.
The tDEM method detects blunders that may be caused by wrong curve fitting in reconstructed DEMs. When calculating annual elevation changes, certain regions (e.g., 1 km × 1 km) on the glacier surface are expected to have similar changes. We approximate the local glacier region by a simple plane equation:
A.x +B.y+C.dh+D = 0
Results:
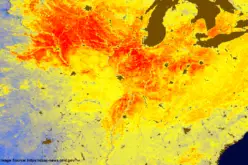
The map of annual elevation change of the two glaciers studied between 2000 and 2014 is given in Figure 8. For reference, the study extended elevation change calculation back to 1986 by including the national DEM from 1986 air photos. The elevation change rates between 1986 and 2000 are simply calculated by subtracting the national DEM from the SRTM DEM.
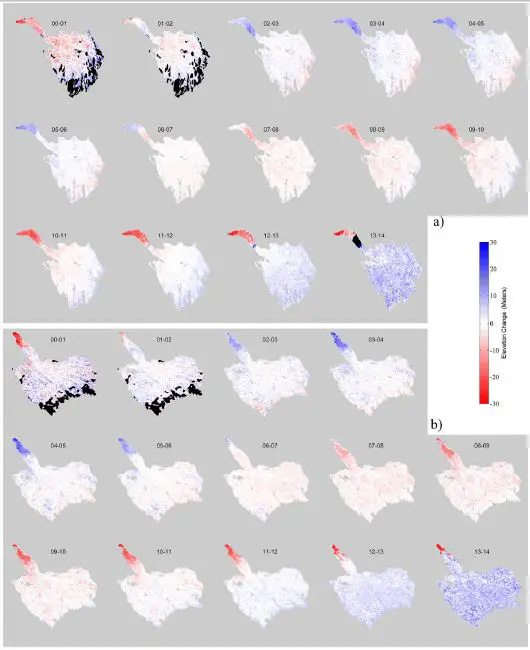
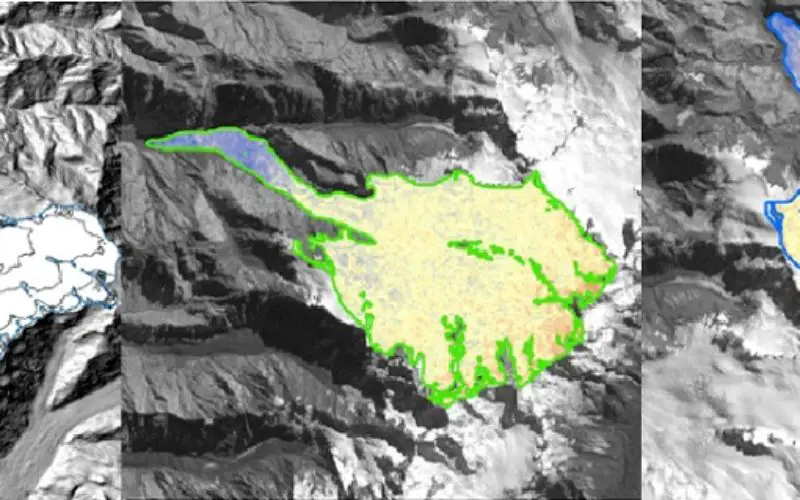
Annual elevation change of (a) Fox Glacier (b) Franz Josef Glacier, modelled by the tDEM method from DEM time series data. Untrusted results due to missing data at the boundaries of the time series are marked with black. Time periods refer to calendar years, i.e., between 1 January of both years.
The volume changes were obtained from the reconstructed DEM time-series. These volume changes are calculated as the difference between two reconstructed DEMs divided by the number of years between the two DEMs, whereas the above average dh/dt are the average of all annual elevation changes over a period calculated from the derivatives of the fitted curves of elevation variation.
The study justifies the methodology to reconstruct glacier elevation change from DEM time-series (tDEM). After initial removal of large outliers, either in relation to a reference DEM or using the RANSAC algorithm, the method generates a 4D DEM by fitting an elevation change development at each DEM pixel. The method tests progressively if linear, quadratic and cubic elevation developments are statistically significant and chooses a final robust spline fit if not.
Source: Modeling Glacier Elevation Change from DEM Time Series – Di Wang and Andreas Kääb – Remote Sens. 2015, 7, 10117-10142; doi:10.3390/rs70810117
Related Link
Confused Between DEM, DTM and DSM !
Airborne Radar Scanning of Glaciers for Climate Change Modeling