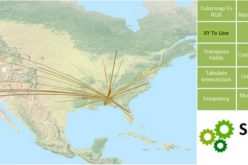
With constant development in information technologies, people often worry about getting too much information instead of getting too little. The ability to sum up information into a simple but clear story is very important. People often say, “A picture is worth a thousand words”. By using SuperGIS Desktop, users can easily integrate various data into one convincing and attractive map.
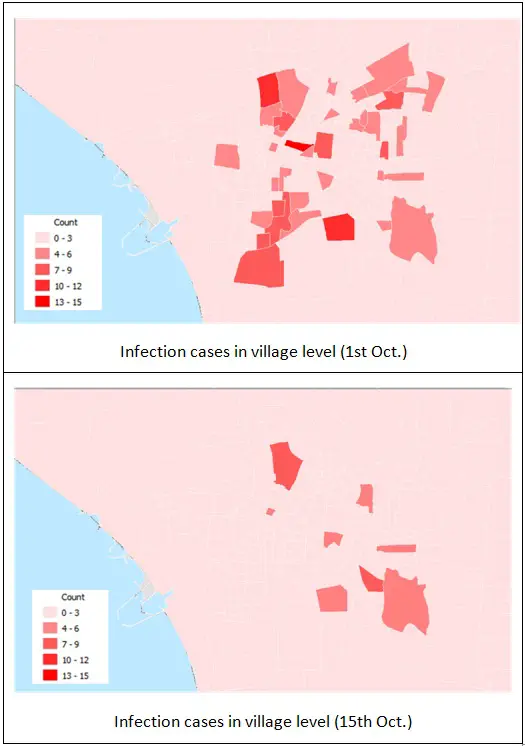
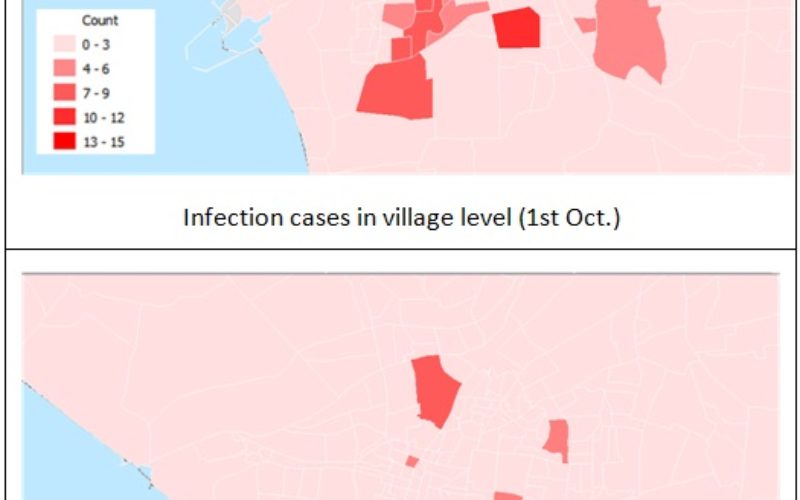
We take the recent outbreak of Dengue fever in Tainan city as an example. The infection cases in October were first collected day by day. By comparing the distribution of cases between 1st October and 15th Oct, we could then quickly realize that the cases of Dengue fever were mainly located in areas with higher population density. As time passed, the new infection cases per day also declined.
The map above was made using open data offered by the Tainan City Government. Earlier this week on 29th October, Supergeo already held a Webinar with several applications that showed users how to integrate GIS and open data for benefiting lives.
The record of this webinar has been published on YouTube:
https://www.youtube.com/watch?v=CEJ0y_bosRQ
Do you want to make your data more persuasive through GIS products?
A free trial for SuperGIS Desktop:
http://www.supergeo.com.tw/d_Desktop_GIS.asp?ProductType=DesktopGIS