
GIS: Revolutionizing Military Strategy and Operations
24K views · Jul 5, 2024 gisresources.com
This video explores how Geographic Information Systems (GIS) technology is transforming modern warfare and defense strategies. It examines the critical applications of GIS in areas such as terrain evaluation, naval operations, air operations, weather analysis, and military logistics. The video also highlights the integration of remote sensing technology with GIS, providing valuable intelligence for military forces.

Satellite_Earthquake_Prediction
4K views · Jun 30, 2024 gisresources.com
Satellite_Earthquake_Prediction

How AI and aerial imagery can improve damage assessments in ...
5K views · Aug 19, 2022 gisresources.com
Technological development for agricultural insurance has been the use of remote imaging for damage assessments. Geospatial tools such as satellite imagery are increasingly being used to reduce the time providers spend in-field, giving them data on a claim before they even reach the farm in question. Furthermore, there’s an opportunity for AIPs to go beyond satellite technology by combining it with high resolution aerial imagery coupled with insights powered by AI, bringing improved accuracy and speed to today’s in-person damage assessment methods.
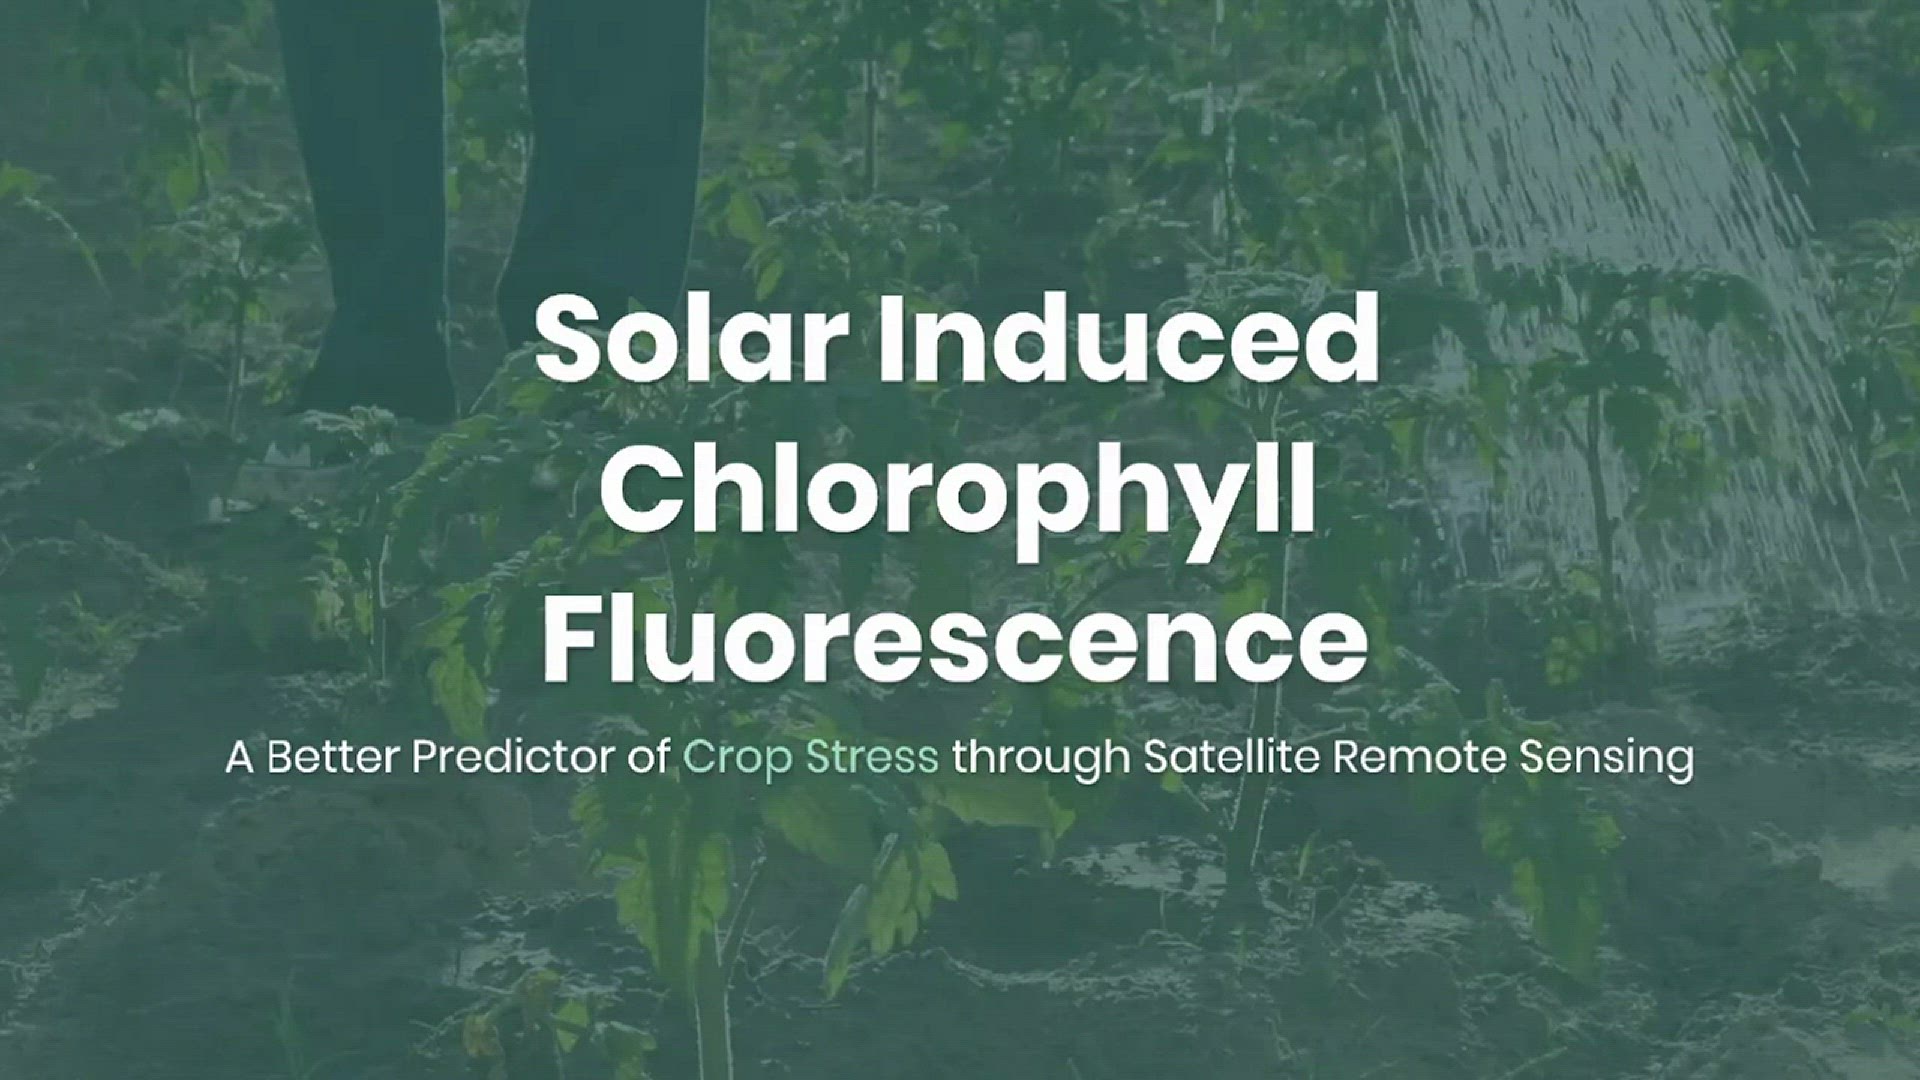
Solar Induced Chlorophyll Fluorescence for Crop Stress Monit...
4K views · Mar 27, 2022 gisresources.com
The Solar Induced Chlorophyll Fluorescence-based crop monitoring method mostly addresses crop physiological changes. This method delivers information to the user from a perspective relating to the crop’s biophysical activities than biochemical changes. Solar Induced Chlorophyll Fluorescence is an electromagnetic signal re-emitted by Chlorophyll-a of a plant which was absorbed by chlorophyll-a and chlorophyll-b from active photosynthetic radiation but unused for photosynthesis.

How Geospatial Technologies Are Bringing Another Green Revol...
6K views · Mar 9, 2022 gisresources.com
How Geospatial Technologies Are Bringing Another Green Revolution In India
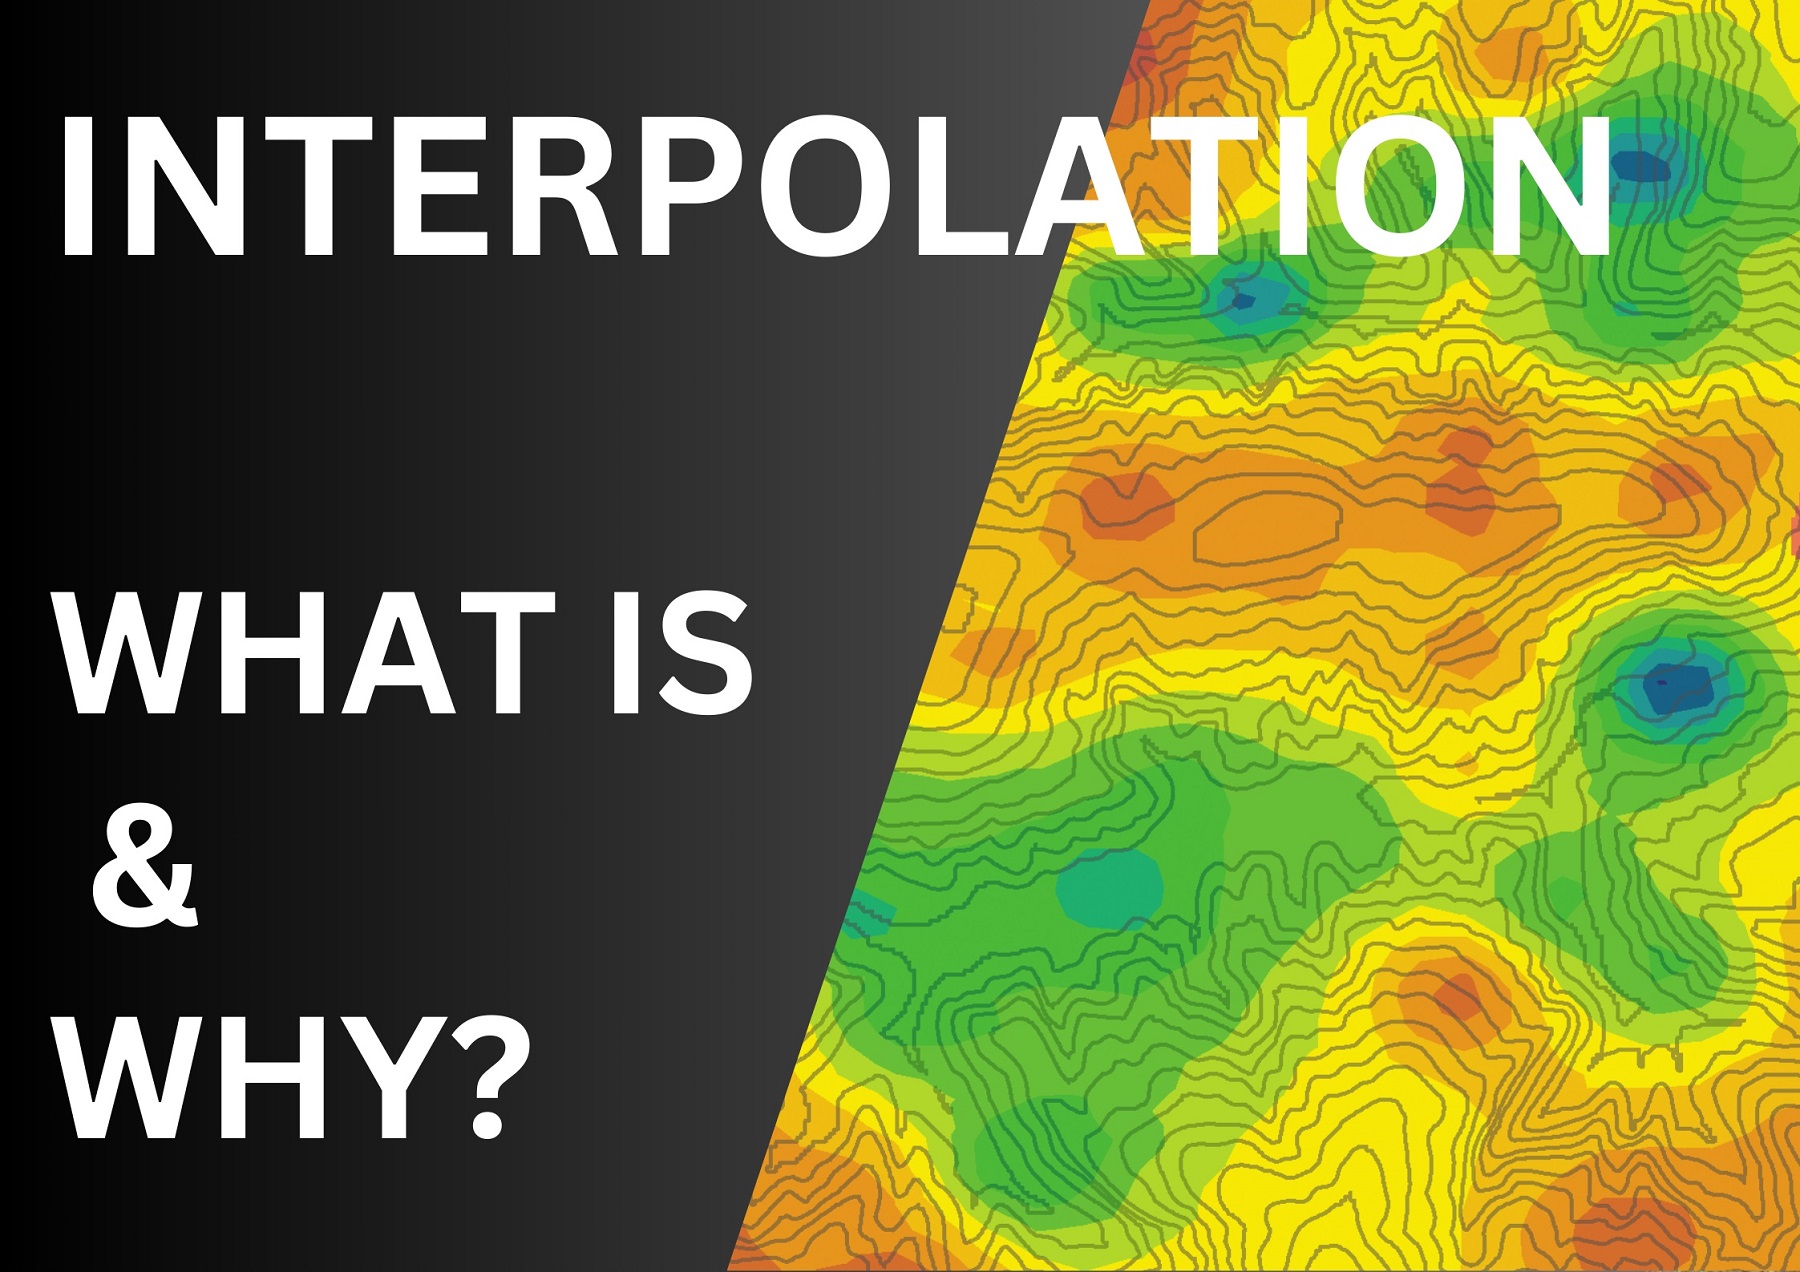
What is Interpolation?
3K views · Sep 1, 2024 gisresources.com
What is InterpolationIn this, we've covered what interpolation is, its purpose, how to choose the right technique, and how it’s applied in GIS. Remember, understanding interpolation is key to making sense of the complex world of spatial data.
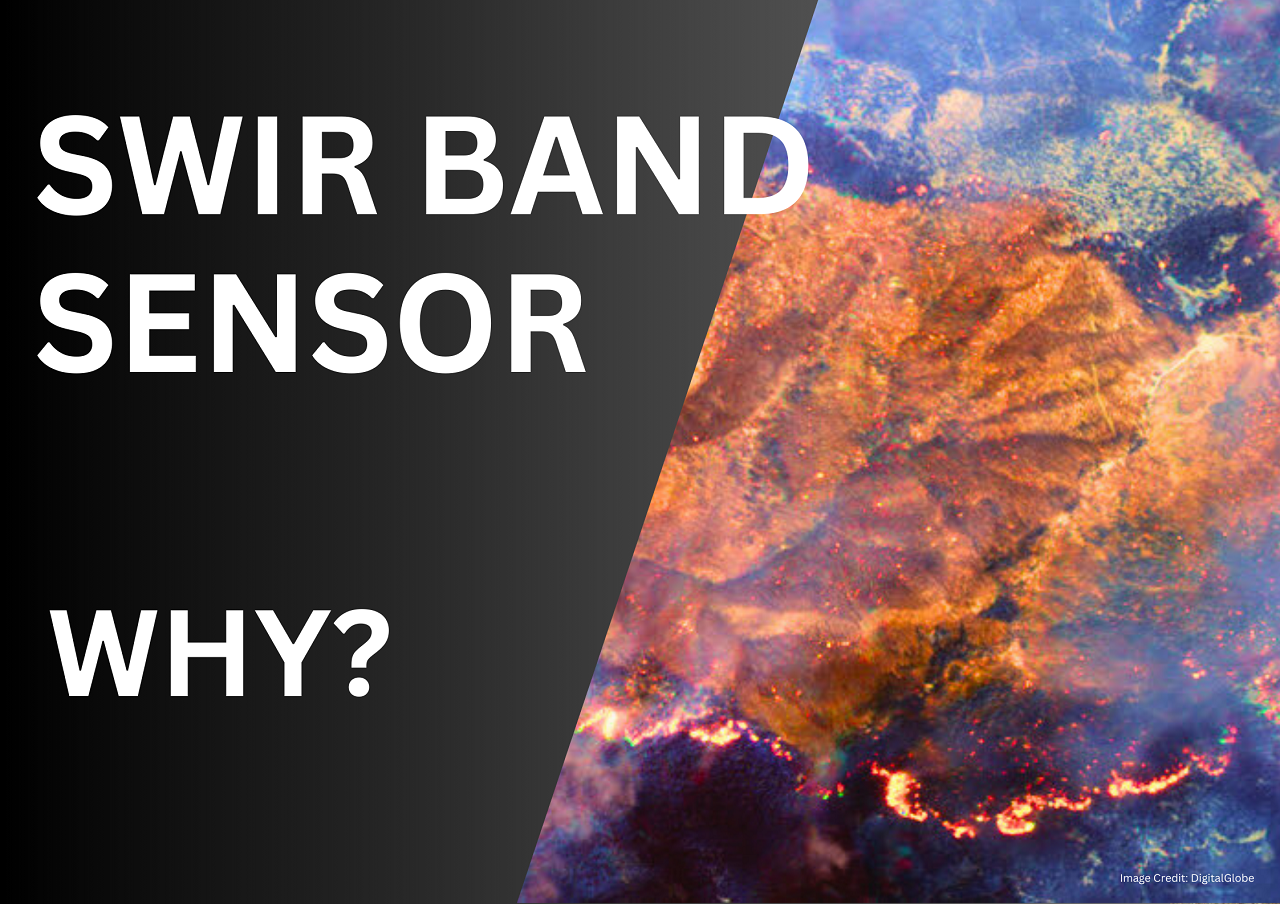
Why SWIR Band in Remote Sensing
1K views · Dec 18, 2024 gisresources.com
Have you ever wondered why we need so many types of sensors in remote sensing? Visible light, near-infrared (NIR), thermal, panchromatic, and now—SWIR, the Shortwave Infrared band! Today, we’ll uncover the secrets of SWIR sensors and why they’re game-changers in the world of remote sensing. Stick around as we compare SWIR sensors with others, explore their amazing applications, and highlight their advantages. Let’s dive in!

Why does NDVI, NDBI, NDWI Ranges From -1 to 1?
588 views · Feb 24, 2025 gisresources.com
Have you ever wondered how scientists monitor Earth's diverse landscapes from space? They utilize powerful tools like NDVI, NDBI, and NDWI to interpret satellite imagery. But what do these indices mean, and why do their values range from -1 to 1? Let's explore! The Normalized Difference Vegetation Index, or NDVI, is a key indicator used to assess vegetation health. It's calculated using the formula: NDVI = (NIR - Red) / (NIR + Red) Here, 'NIR' represents the reflectance in the near-infrared spectrum, and 'Red' denotes the reflectance in the red spectrum. Healthy vegetation absorbs most visible light, especially red, and reflects a significant portion of near-infrared light. This contrast results in higher NDVI values, indicating robust plant life. Next, we have the Normalized Difference Built-up Index, or NDBI, which helps identify urban and built-up areas. It's computed as: NDBI = (SWIR - NIR) / (SWIR + NIR) 'SWIR' stands for short-wave infrared reflectance. Built-up regions reflect more SWIR and less NIR, leading to positive NDBI values. Conversely, natural surfaces like vegetation reflect more NIR, resulting in negative NDBI values. Lastly, the Normalized Difference Water Index, or NDWI, is designed to highlight water bodies. It's calculated using: NDWI = (Green - NIR) / (Green + NIR) Water features absorb NIR light and reflect green light, resulting in positive NDWI values. Land areas, on the other hand, typically yield zero or negative values.
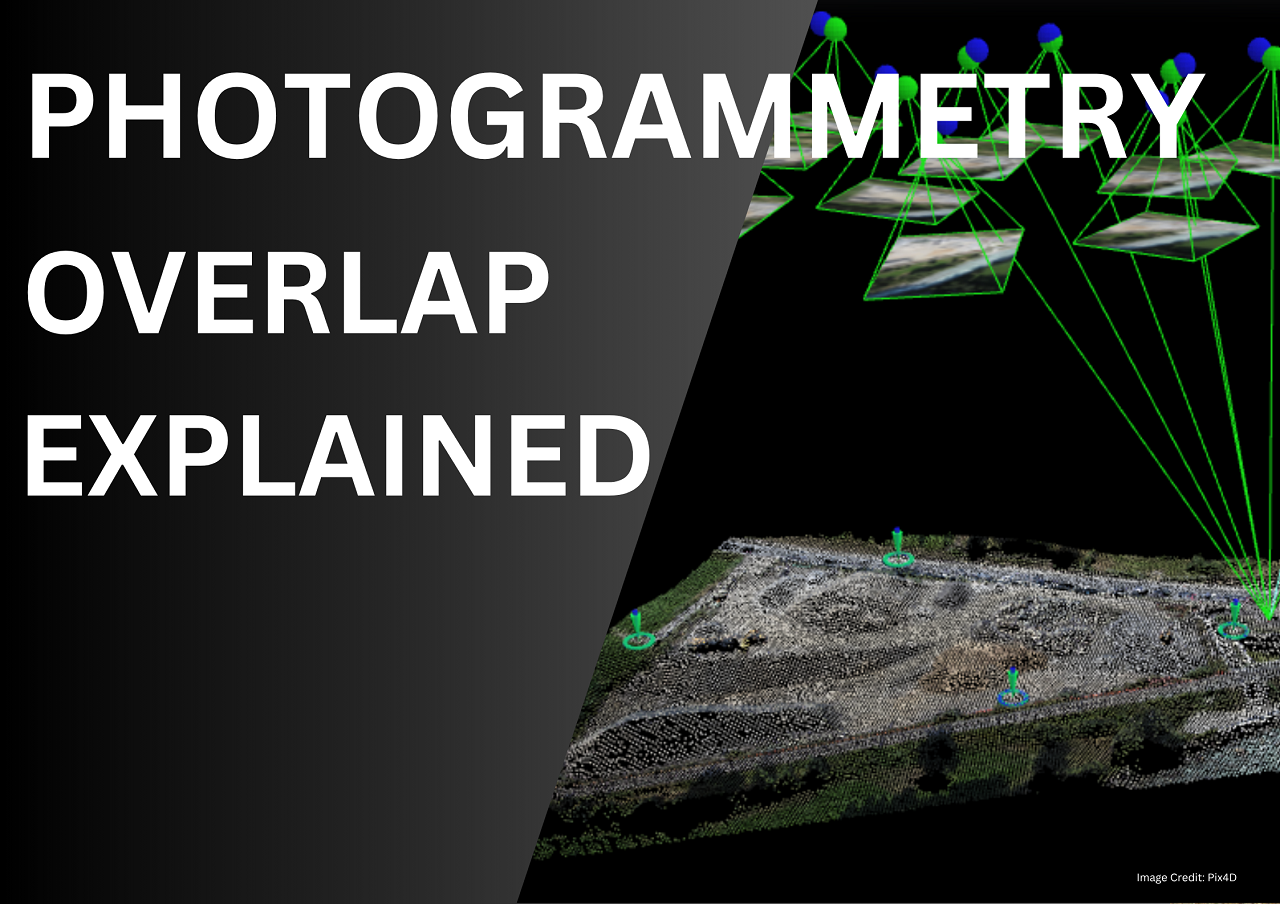
Types of Overlap in Photogrammetry Explained
81 views · May 31, 2025 gisresources.com
📸 Learn the secrets behind perfect drone mapping and 3D model accuracy! In this video, we break down the Types of Imagery Overlaps in Photogrammetry — including forward overlap, side overlap, and triple overlap. Discover how overlaps help create accurate 3D maps and why more overlap isn’t always better! 🧠 Understand: What is image overlap in photogrammetry Ideal overlap percentages (70%, 80%, etc.) Common problems with too much overlap Solutions and best practices for drone pilots Real-world exceptions where high overlap is essential Whether you’re flying drones for land surveying, construction, agriculture, or GIS, mastering overlap is key to accuracy and efficiency. ✅ Watch till the end to learn about exceptions to the rule and get actionable tips! 📽️ Also, check out our related video: Basics of Photogrammetry – a perfect guide for beginners! 👉 https://www.youtube.com/watch?v=t-x_9aXr2hM&t=21s 🔔 Subscribe for more tutorials on drone surveying, photogrammetry, and GIS resources. 💬 Got questions or feedback? Leave a comment below. 👍 Like | 🔁 Share | 🔔 Subscribe #Photogrammetry #DroneMapping #OverlapInPhotogrammetry #GISBasics #DroneSurveyTips #AerialSurveying #MappingTutorial