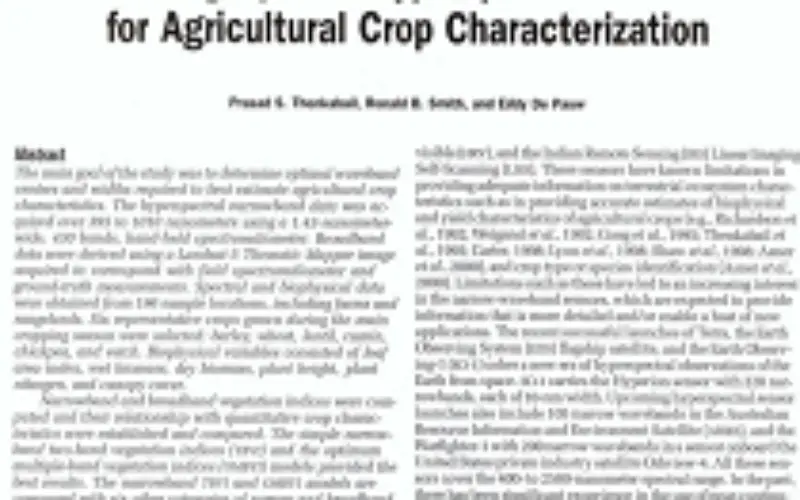
Evaluation of Narrowband and Broadband Vegetation Indices for Determining Optimal Hyperspectral Wavebands for Agricultural Crop Characterization
Evaluation of Narrowband and Broadband Vegetation Indices for Determining Optimal Hyperspectral Wavebands for Agricultural Crop Characterization
By: Prasad S. Thenkabail, Ronald B. Smith, and Eddy De Pauw
 Abstract: The main goal of the study was to determine optimal waveband centers and widths required to best estimate agricultural crop characteristics. The hyperspectral narrowband data was ac- quired over 395 to 1020 nanometers using a 1.43-nanometer- wide, 430 bands, hand-held spectroradiometer. Broadband data were derived using a Landsat-5 Thematic Mapper image acquired to correspond with field spectroradiometer and ground-truth measurements. Spectral and biophysical data were obtained from 196 sample locations, including farms and rangelands. Six representative crops grown during the main cropping season were selected: barley, wheat, lentil, cumin, chickpea, and vetch. Biophysical variables consisted of leaf area index, wet biomass, dry biomass, plant height, plant nitrogen, and canopy cover.
Narrowband and broadband vegetation indices were com- puted and their relationship with quantitative crop characteristics were established and compared. The simple narrow- band two-band vegetation indices [TBVI] and the optimum multiple-band vegetation indices [OMBVI] models provided the best results. The narrowband TBW and OMBvI models are compared with six other categories of narrow and broadband indices. Compared to the best broadband TM indices, TBW explained up to 24 percent greater variability and OMBVI explained up to 27 percent greater variability in estimating different crop variables. A Predominant proportion of crop characteristics are best estimated using data from four nar- rowbands, in order of importance, centered around 675 nanometers [red absorption maxima), 905 nm (near-infrared reflection peak), 720 nm [mid portion of the red-edge), and 550 nm [green reflectance maxima). The study determined 12 spectral bands and their bandwidths [Table 5] that provide optimal agricultural crop characteristics in the visible and near-infrared portion of the spectrum.