European Space Agency’s (ESA) GOCE Satellite Mission to Map Earth’s Gravity Draws to a Close
After mapping variations in Earth’s gravity with unprecedented detail for four years, the GOCE satellite has run out of fuel and the end of mission has been declared.
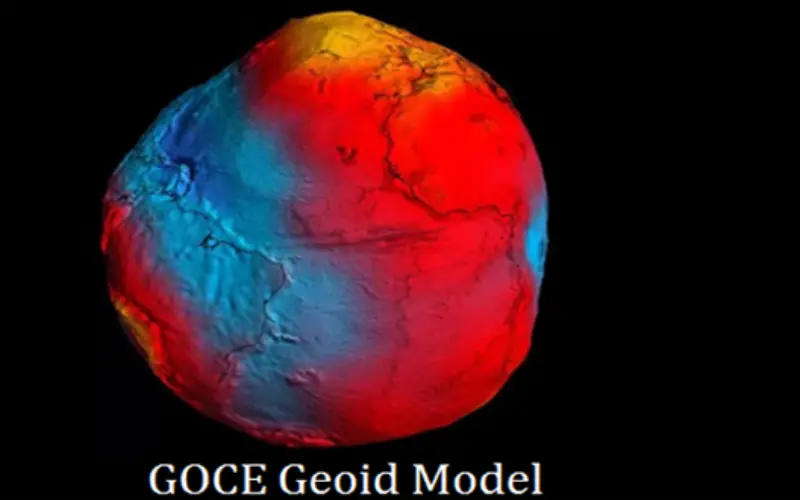
Since March 2009, the Gravity field and steady-state Ocean Circulation Explorer – GOCE – has been orbiting Earth at the lowest altitude of any research satellite. Its ‘gradiometer’ – the sensitive instrument measuring gravity in 3D – was the first in space and has mapped variations in Earth’s gravity with unrivalled precision. The result is a unique model of the ‘geoid’, which is essentially the shape of an ideal global ocean at rest and therefore critical for accurate measurements of ocean circulation and sea-level change.
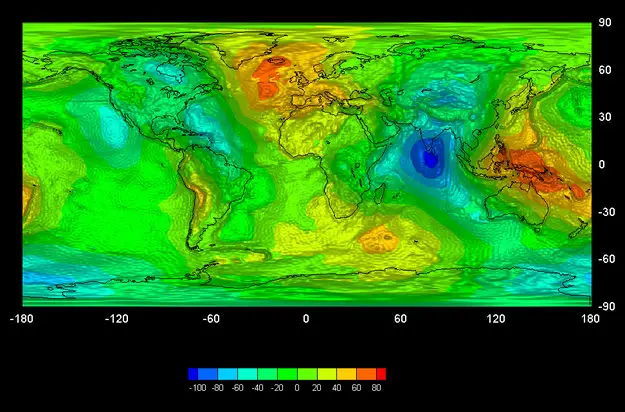
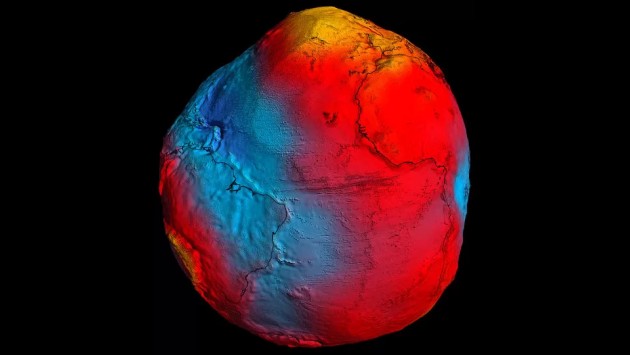
Earth’s Gravity Map. Source: ESA
The initial map, which is based on two months of data, illustrates the varying strength of gravity. Blue indicates weak areas, green is average and orange is strong. The deviations occur because the Earth isn’t entirely spherical, which means that the gravity isn’t equal across the planet.
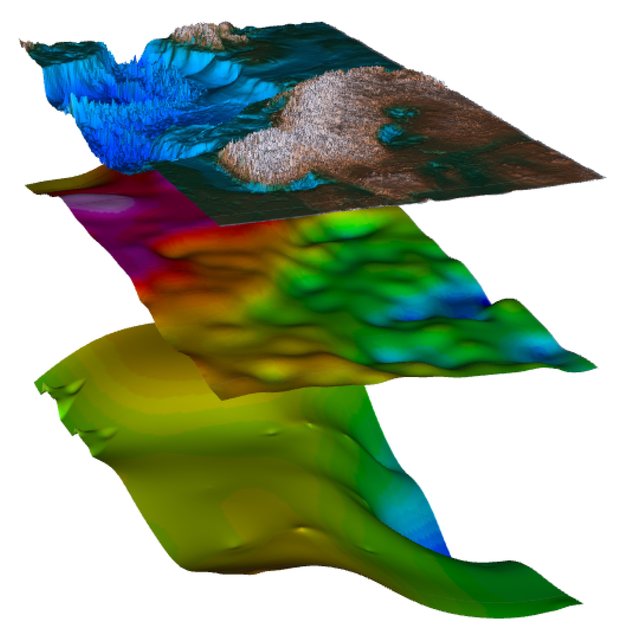
GOCE has provided dynamic topography and circulation patterns of the oceans with unprecedented quality and resolution, improving our understanding of the dynamics of world oceans. Scientists further exploited GOCE’s data to create the first global high-resolution map of the boundary between Earth’s crust and mantle – called the Moho.
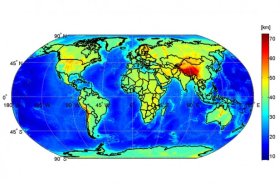
Moho Discontinuity Map:The first global high-resolution map of the boundary between Earth’s crust and mantle – the Moho – has been produced based on data from ESA’s GOCE gravity satellite. Understanding the Moho will offer new clues into the dynamics of Earth’s interior. Source: ESA
The satellite also became the first seismometer in orbit when it detected sound waves from the massive earthquake that hit Japan on 11 March 2011.
Although the planned mission was completed in April 2011, the fuel consumption was much lower than anticipated because of the low solar activity, enabling ESA to extend GOCE’s life. Last week, on 21 October, the mission came to a natural end when it ran out of fuel. The satellite is expected to re-enter Earth’s atmosphere in about two weeks.
Facts and Figures – GOCE
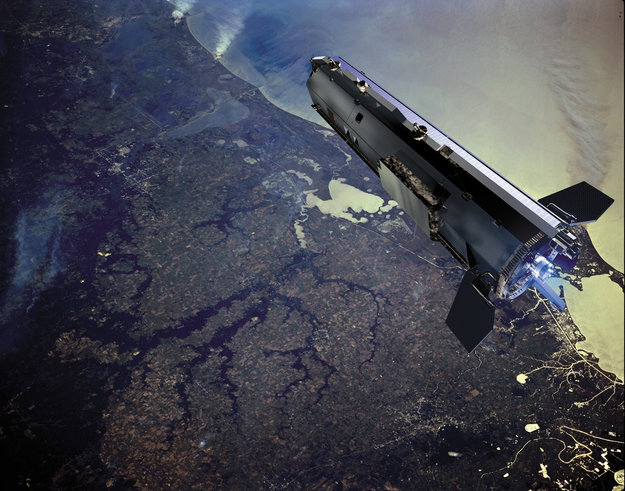
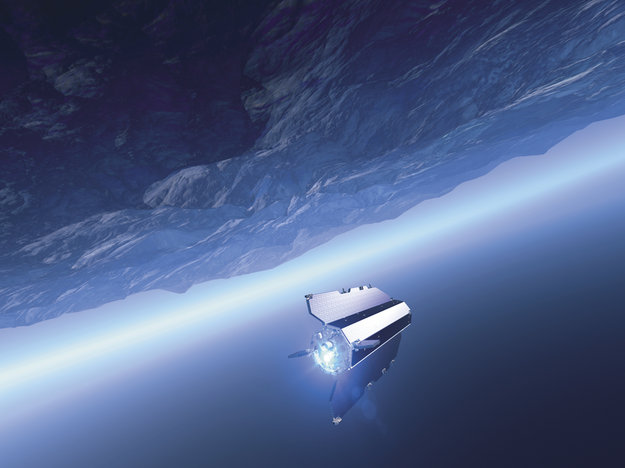
Artist Impression of GOCE Large. Source: ESA
Full name: Gravity field and steady-state Ocean Circulation Explorer
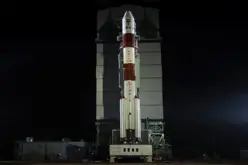
Launched: 17 March 2009
Launcher: Rockot (with Breeze-KM upper stage) by Eurockot Launch Services GmbH
Launch site: Plesetsk Cosmodrome, Russia
Mission control: European Space Operations Centre (ESOC), Darmstadt, Germany
Data download: to Kiruna (Sweden) and Svalbard (Norway) ground stations
Processing & archiving: ESA’s Earth observation centre in Italy (ESRIN) and the distributed High-level Processing Facilities
Number of instruments: 3
Nominal life: 20 months
Mission cost: €350 million (including launcher and operations)
Orbit: about 260 km altitude, polar, Sun-synchronous
Mass: 1100 kg
Size: 5.3 m long, about 1 m body diameter
Propulsion tank: 40 kg of xenon
Geoid accuracy: 1 – 2 cm vertically with 100 km spatial resolution
Gravitational acceleration at Earth’s surface is about 9.8 m/s², varying from a minimum of 9.788 m/s² at the equator to a maximum of 9.838 m/s² at the poles. The six accelerometers (three pairs in three orthogonal directions) are some 100 times more sensitive than any previously flown in space.
GOCE Data
GOCE will gather data to map the Earth’s gravity field for around 20 months. In order to turn the raw data into products that are suitable for users worldwide, there are a number of steps that have to be taken. This part of the mission involves the so-called ground segment, which is essentially made up of three main components – mission control, data processing centres & long-term data storage and services to provide data to users.
GOCE is controlled and operated by the Flight Operations Segment at ESA’s European Space Operations Centre (ESOC), in Darmstadt, Germany. From here, the health and status of GOCE is monitored and commands are generated and sent to the satellite.
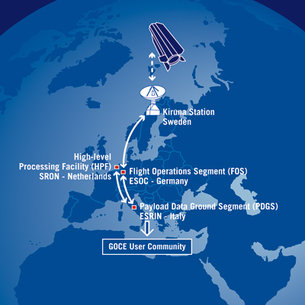
GOCE data flow. Source: ESA
Raw data are downlinked from the GOCE spacecraft to the ground stations in Kiruna, northern Sweden, and on Svalbard. Once the data are received at the ground stations, they are immediately forwarded to the Flight Operations Segment, which then sends the data to the Payload Data Ground Segment at ESA’s European Space Research Institute (ESRIN), in Frascati, Italy.
Image Gallery
GOCE. Source: ESA
Moho and Lithosphere. Source: ESA
GOCE Geoid Model. Source: ESA
Reference: ESA, Spatial Sources