Drought is condition when a region notes a deficiency in its water supply whether surface or underground water. A drought can last for months or years, or may be declared after as few as 15 days.
Water scarcity has been frequently occurring these days in many parts of the world, partly because water demand has increased manifold due to the growth in population and expansion of agricultural, energy and industrial sectors, and partly because of climate change and contamination of water supplies (Bates et al., 2008). The water scarcity is being further compounded by droughts which affect both surface water and groundwater resources and can lead to reduced water supply, deteriorated water quality, crop failure and disturbed riparian habitats (Riebsame et al., 1991). Therefore, understanding drought and modeling its components have drawn attention of ecologists, hydrologists, meteorologists, and agricultural scientists. Droughts are of great importance in water resources planning and management, and for a review of drought concepts the reader is referred to (Mishra and Singh, 2010).
Drought forecasting is a critical component of drought hydrology which plays a major role in risk management, drought preparedness and mitigation. There has been considerable work done on modeling various aspects of drought, such as identification and prediction of its duration and severity. However, a major research challenge is to develop suitable techniques for forecasting the onset and termination points of droughts. One of the deficiencies in mitigating the effects of a drought is the inability to predict drought conditions accurately for months or years in advance.
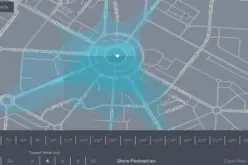
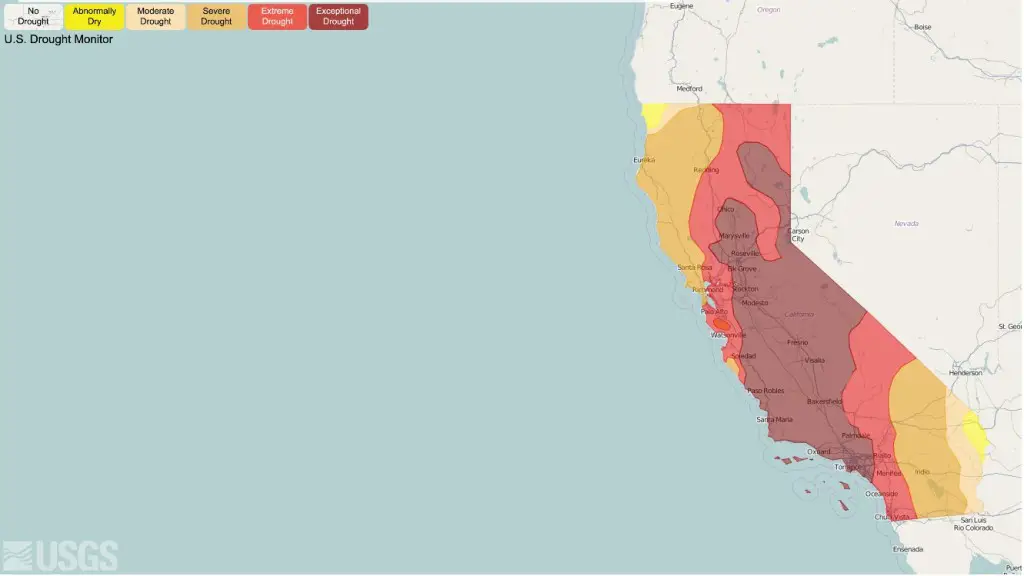
The United States Geological Survey (USGS) has developed a web application for drought monitoring of California. The State of California is experiencing one of the most severe droughts on record, which has implications for citizens of California and beyond. Many State, Federal, and Tribal agencies make routine observations of the water cycle. This website graphically visualizes these data to help understand the effect of drought on rivers, streams, lakes, and reservoirs. Below, learn more about water use and changes in the water cycle due to the current drought in California.
The data presented here are drawn from free and publicly accessible sources. In addition, the analytical, graphical, and software tools used are open-source and available for public re-use. The USGS closely monitors the effects of drought through data collection and research, and is studying the current drought in the context of long-term hydrologic, climatic, and environmental changes. These studies support successful planning and science-based decision-making by water managers who must address complex issues and competing interests in times of drought. They also and help decision-makers prepare for climate change and possible future drought.
The website provides insight to the drought areas as No Drought, Abnormally Dry, Moderate Drought, Severe Drought, Extreme Drought and Exceptional Drought.
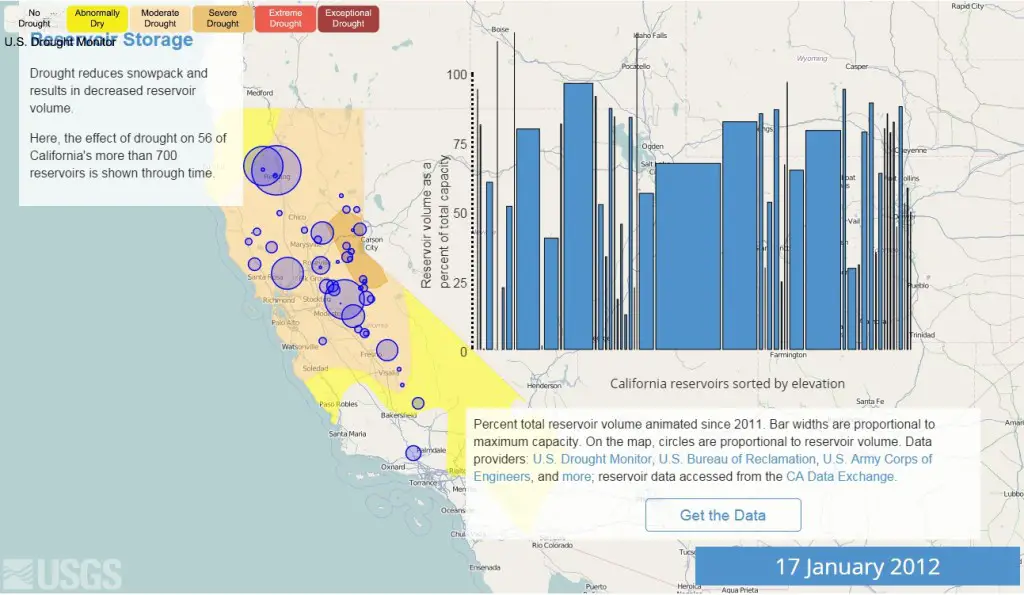
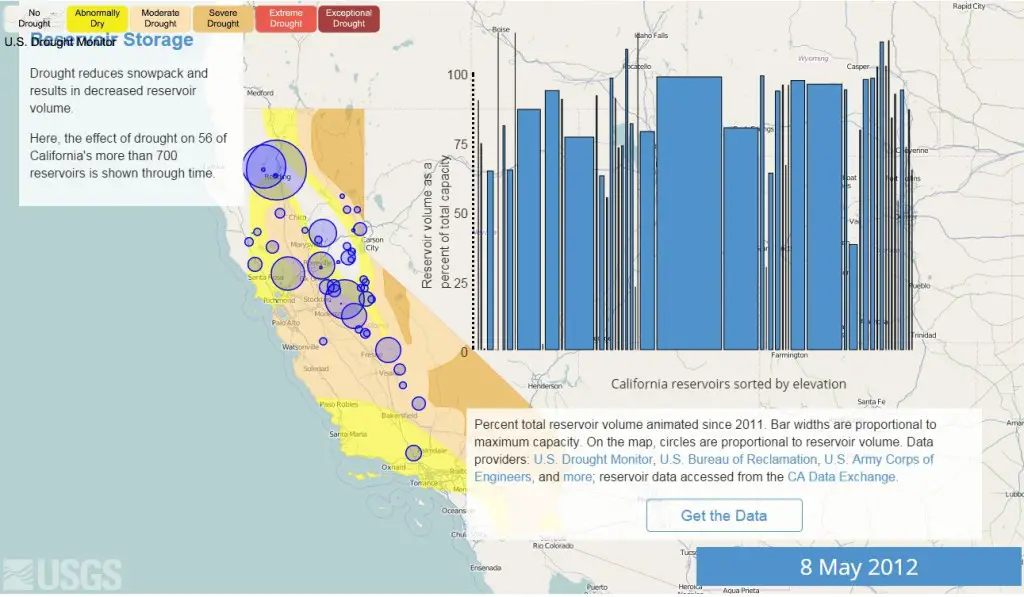

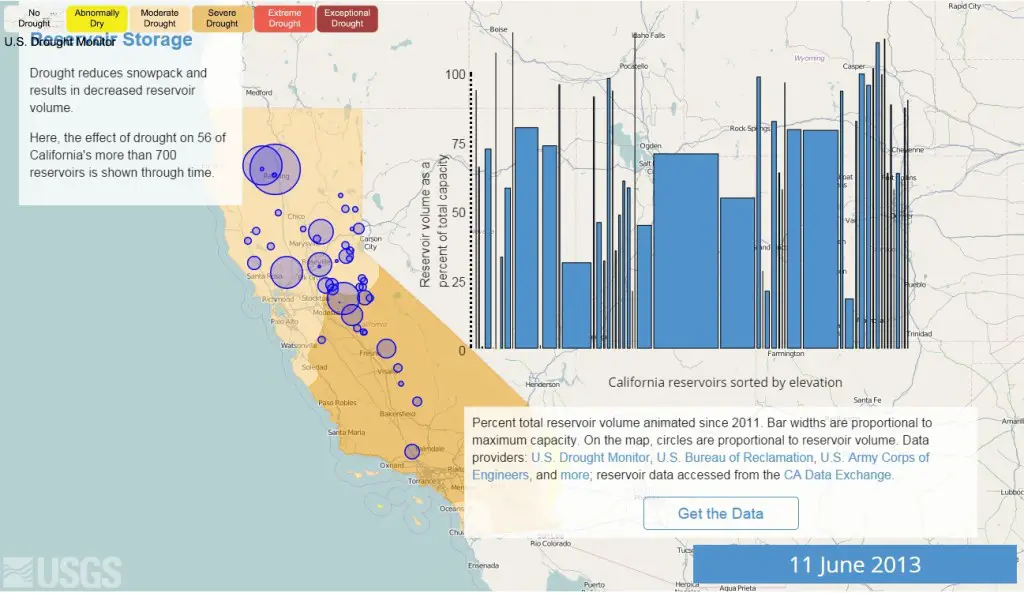
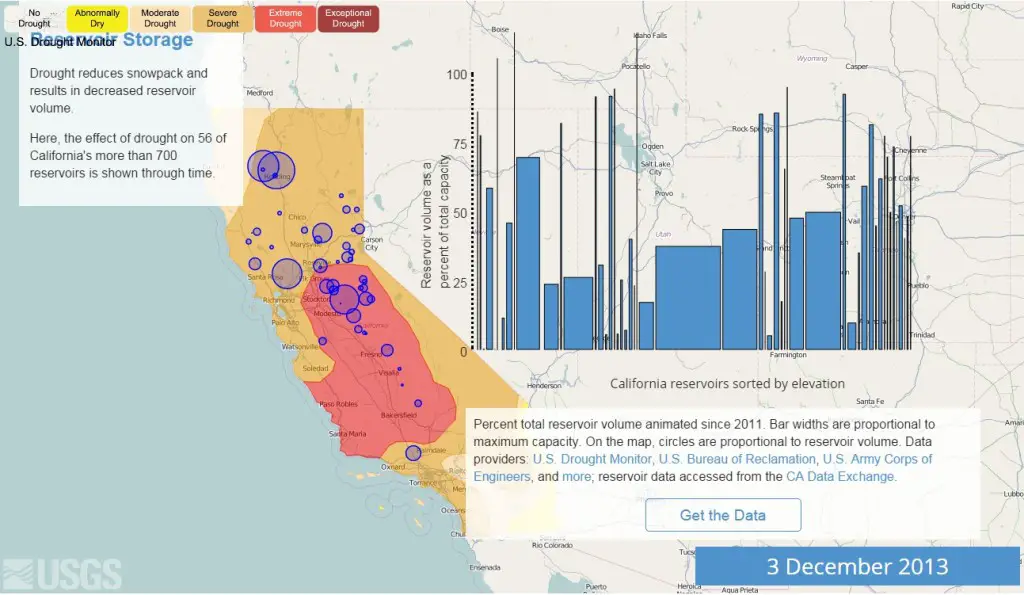

The data reveals that drought reduces snowpack and results in decreased reservoir volume. Here, the effect of drought on 56 of California’s more than 700 reservoirs is shown through time. Snowpack in California is the primary source of water to reservoirs that serve drinking water, agriculture, and hydroelectric needs. For any given year, less wintertime snowpack results in lower reservoir levels, and less water for consumptive use. In 2014, California received only a fraction of its normal precipitation and snow pack, with the State now facing three years of devastating drought.


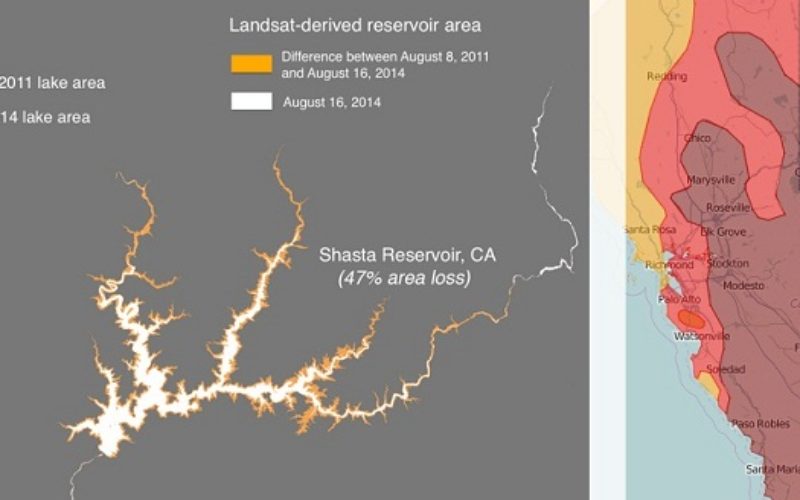
The website also provides estimated reservoir surface area loss using USGS’s Landsat satellite imagery.
Visit the California Drought Monitor