Centers for Medicare & Medicaid Services Has Launched Drug Mapping Tool Available
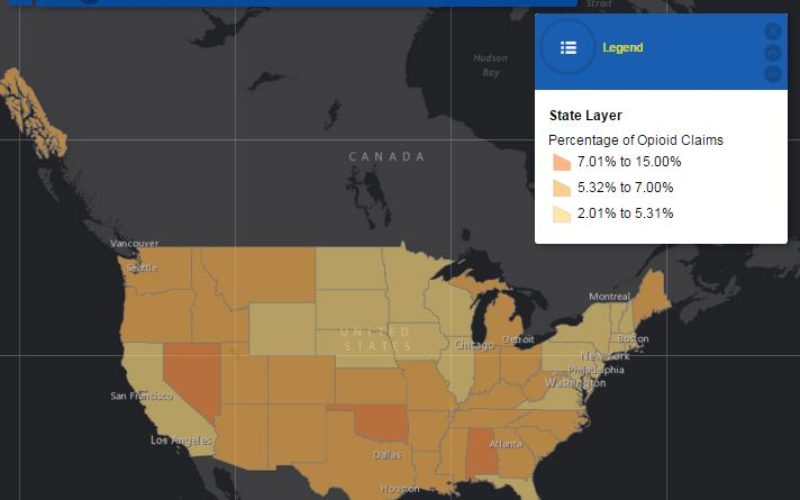
Interactive online drug mapping tool allows public to search Medicare Part D opioid prescription claims data at the state, county, and ZIP code levels.
The Centers for Medicare & Medicaid Services (CMS) released an interactive online mapping tool(http://go.cms.gov/opioidheatmap) which shows geographic comparisons at the state, county, and ZIP code levels of de-identified Medicare Part D opioid prescription claims – prescriptions written and then submitted to be filled – within the United States. This new mapping tool allows the user to see both the number and percentage of opioid claims at the local level and better understand how this critical issue impacts communities nationwide.
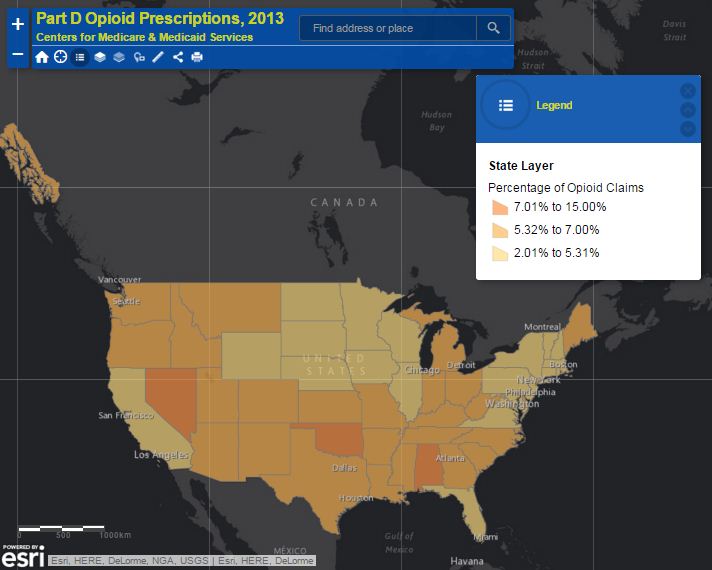
Medicare Part D Opioid Drug Mapping Tool
The data used in this mapping tool is from 2013 Medicare Part D prescription drug claims prescribed by health care providers and does not contain beneficiary information (https://www.cms.gov/Research-Statistics-Data-and-Systems/Statistics-Trends-and-Reports/Medicare-Provider-Charge-Data/Part-D-Prescriber.html). The data set, which is privacy-protected, contains information from over one million distinct providers who collectively prescribed approximately $103 billion in prescription drugs and supplies paid under the Part D program. The data characterizes the individual prescribing patterns of health providers that participate in Medicare Part D for over 3,000 distinct drug products. Of the 1.4 billion total Part D claims per year, there were approximately 80.7 million opioid claims for 116 distinct opioid products contributing to $3.7 billion of the total Part D prescription drug costs. By openly sharing data in a secure, broad, and interactive way, CMS is supporting a better understanding of regional provider prescribing behavior variability and is adding insight to local health care delivery.
The tool includes interactive maps that allow users to mouse over an area and see its data. The data for each geographic region includes:
Percentage of opioid claims
- State average
- National average
- Total providers
- Total opioid claims
- Total claims
CMS and the U.S. Department of Health and Human Services (HHS) believe that this level of transparency will inform community awareness among providers and local public health officials.
For more information on CMS’ efforts to address the growing problem of abuse of opioids in the Part D program, read the Part D Overutilization Monitoring System Summary (http://cms.gov/Newsroom/MediaReleaseDatabase/Fact-sheets/2015-Fact-sheets-items/2015-11-03.html).
Source: CMS.gov


